3.2 KiB
+++ title = "Monitoring Synapse Metrics with Prometheus" path = "/blog/2015/04/23/monitoring-synapse-metrics-with-prometheus"
[taxonomies] author = ["Matthew Hodgson"] category = ["Tutorials"] +++
Note: This blog post is outdated, and an up-to-date tutorial is located on the synapse project repo
Synapse has had support for exporting a comprehensive range of metrics via HTTP since 0.8.1 - we added this to help quantify the benefits of all the performance work which is going on currently in advance of Synapse 0.9. If you're interested in monitoring your own synapse and seeing what's going on using something like Prometheus, Leo just wrote a quick tutorial on getting up and running:
How to monitor Synapse metrics using Prometheus
- 1: Install prometheus:
- Follow instructions at http://prometheus.io/docs/introduction/install/
- 2: Enable synapse metrics:
- Simply setting a (local) port number will enable it. Pick a port. prometheus itself defaults to 9090, so starting just above that for locally monitored services seems reasonable. E.g. 9092:
Add to homeserver.yaml
metrics_port: 9092
Restart synapse
- 3: Check out synapse-prometheus-config
- https://github.com/matrix-org/synapse-prometheus-config
- 4: Add
synapse.htmlandsynapse.rules - The
.htmlfile needs to appear in prometheus'sconsolesdirectory, and the.rulesfile needs to be invoked somewhere in the main config file. A symlink to each from the git checkout into the prometheus directory might be easiest to ensuregit pullkeeps it updated. - 5: Add a prometheus target for synapse
- This is easiest if prometheus runs on the same machine as synapse, as it can then just use localhost:
global: {'{'} rule_file: "synapse.rules" {'}'}job: {'{'} name: "synapse"
target_group: {'{'} target: "http://localhost:9092/" {'}'} {'}'}
- 6: Start prometheus:
./prometheus -config.file=prometheus.conf
- 7: Wait a few seconds for it to start and perform the first scrape,
- then visit the console:
http://server-where-prometheus-runs:9090/consoles/synapse.html
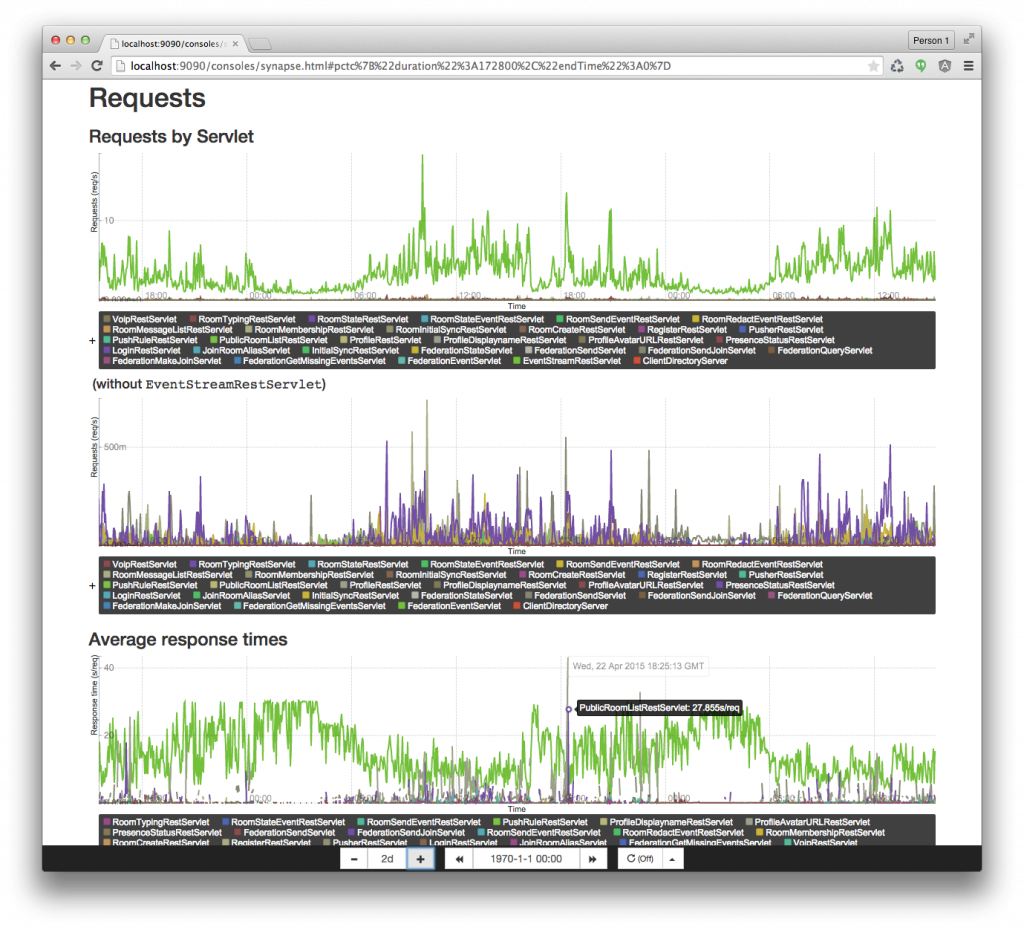
And the end result looks something like...
...amongst many many other system & application metrics.
You can grab the latest version of the tutorial at https://github.com/matrix-org/synapse/blob/master/docs/metrics-howto.md - thanks to Leo for writing it up. Any questions, let us know!
